People Counting by Industry: Retail, Airports, Smart Offices, Museums & Outdoor (2026 Hub)
Quick Answer (TL;DR)
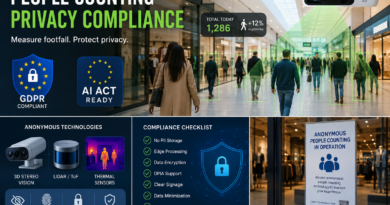
People counting deployments differ sharply by industry. Retail uses 3D stereo or AI cameras to drive conversion-rate KPIs (typical payback 2–9 months). Shopping malls need landlord-grade reporting and tenant isolation. Airports & transit use LiDAR for queue management and capacity planning. Smart offices use thermal or radar for desk and meeting-room occupancy. Libraries and museums overwhelmingly choose thermal for privacy. Outdoor / smart city deployments use radar or LiDAR.
Right tech per sector: Retail → 3D stereo or AI camera · Mall → 3D stereo · Airport → LiDAR · Office → thermal or radar · Museum/Library → thermal · Outdoor → mmWave radar or LiDAR.
The reason this page exists is simple: when a retailer, an airport operations manager and a library director all say “we need a people counter,” they want very different things. The retailer cares about conversion rate down to the half-hour. The airport ops manager needs queue times in real time. The library director needs a number defensible enough to put in a funding application to central government. Same hardware family, completely different problems.
We work with all of them. So this page is the map. Below, we walk through six industries we know well, what each one actually does with the data, which sensor we’d specify if we were buying tomorrow, and the deeper guides we’ve written on each. If you want the underlying technology story first, jump to our People Counting Systems pillar. If you’re already vendor-shopping, the 2026 Power List is where to land.
1. Retail Stores & Chains
Retail invented this category, and it’s still the biggest market for it. Pretty much every retail KPI worth tracking — conversion rate, sales per visitor, capture rate, staff-to-traffic ratio, marketing attribution — falls apart without an accurate denominator. We’ve watched chains run for years on guesswork; the moment they get clean footfall data, the staffing model changes within a fortnight.
Most of the retailers we work with are doing four things with the data on day one: staff-scheduling to actual hourly demand instead of last year’s spreadsheet, A/B testing window displays with a real before-and-after capture rate, attributing marketing spend by watching same-day uplift in store traffic, and ranking stores against each other on a fair like-for-like basis. The sensor choice is almost always 3D stereo at the front door for accuracy, or AI cameras if budget is the dominant pressure. Pick what your conversion-rate ambition can defend.
Essential reading for retail:
- Comprehensive Guide to Top Retail People Counting Solutions
- Footfall Counting Complete Guide 2026
- 20 Essential Retail KPIs
- KPIs for People Counting Sensors
- How People Counting Data Can Skyrocket Retail Sales
- A Tale of Two Store Managers
- The Power of Heatmaps in Retail
- Top Providers and Their Retail Clients
2. Shopping Malls & Mixed-Use Centres
Mall operators sit in an unusual spot. They’re both landlords (selling space to tenants, who very much want to see the traffic numbers) and curators (running a shared environment that has to feel busy without feeling crowded). That dual job creates a unique sensor brief: rock-solid totals at every external entrance for landlord reporting, tenant-specific counts at every internal shopfront for lease negotiations, anchor-store analysis to show co-tenancy value, and zone-level heatmaps to price advertising space. Several mall operators we’ve worked with also bolt parking analytics on top, so they can match car counts to people counts and back out a true catchment estimate.
The stack we usually recommend: 3D stereo at every external door, LiDAR or AI cameras for inside-the-mall zone work, and a single platform that can export tenant-specific feeds via API or CSV. The biggest implementation question is almost never the sensor — it’s the data-sharing model with tenants. Our dedicated mall write-up walks through both.
Mall-specific resources:
3. Airports, Train Stations & Public Transport
Transport is where the accuracy bar gets uncomfortably high. The data isn’t just feeding a marketing dashboard — it’s flowing into safety reports, regulatory filings, and live operational decisions that affect thousands of passengers an hour. Queue management at security, check-in and immigration. Capacity planning at gates. Concession sales reporting for retail tenants in the terminal. Evacuation modelling for emergency planning. None of those tolerate the kind of 80% accuracy that’s fine in a high-street store.
That’s why LiDAR has quietly become the default in modern airport deployments — wide coverage from a single ceiling-mounted sensor, total darkness operation, no privacy debate. On the rail and bus side, the dominant install is on-board: automatic passenger counters at every door, usually 3D stereo or thermal, feeding back to the depot over cellular. We covered the on-board angle in our People Counters in Transportation article and the airport-specific operational side via the Hella spotlight.
Transport reading list:
4. Smart Offices & Corporate Buildings
If retail invented people counting, hybrid working reinvented it. Between 2020 and 2024, “occupancy analytics” went from a niche FM tool to a board-level KPI. Facilities teams now use real-time occupancy to right-size HVAC and lighting — we’ve seen 15–30% energy savings on the projects we’ve measured — to plan desk and meeting-room provision, and to give CFOs evidence-based numbers for return-to-office decisions.
The technology selection in offices is more nuanced than in retail because you’re really running three different deployments under one roof. Thermal or radar at building entrances for clean total-occupancy numbers (and the strong privacy story your works council will want). Ceiling-mounted 3D or AI cameras in collaboration zones to see how meeting rooms and breakout areas actually get used. Individual desk sensors — usually small PIR or radar pucks — under hot-desks to feed the desk-booking app. The make-or-break detail is integration: badge access, calendar systems and BMS all need to share a single view of who’s in.
For technology selection in office environments, see How to Choose the Right People Counter and People Counting Solutions Compared.
5. Public Sector: Libraries, Museums, Government Buildings

Public-sector projects are an interesting combination — the tightest privacy mandates we encounter, the smallest budgets we encounter, and some of the highest-stakes use cases. Most national library and museum funding formulas reference visitor numbers directly, so the count isn’t a nice-to-have, it’s a line item in next year’s budget. On top of that, the sector has to manage fire-code capacity, and increasingly wants visitor-experience analytics for service planning.
The technology choice is usually decided for us before we walk in the door: thermal or 3D stereo. Both deliver genuinely anonymous counting and both clear 95% accuracy in normal indoor conditions. AI cameras almost always get rejected on principle, regardless of how well the GDPR documentation reads.
Museums are a slight special case because they care about zone-level visitor flow inside the building, not just totals at the door. Which paintings draw a crowd? Which rooms are dead? Which routes do visitors actually take? Those questions need ceiling-mounted sensors throughout the building, ideally feeding a heatmap visualisation. Our dedicated Museums Guide walks through the full stack — entrance sensors, exhibit-zone sensors, ticketing integration, and what ICOM and Arts Council reports actually need.
6. Outdoor, Smart Cities & Events
Outdoor is the newest growth area and easily the hardest, technically. The sensor has to survive rain, snow, summer sun, salt air near the coast, and the occasional unkind teenager. It also has to handle a much wider catchment than anything indoors — covering a plaza, a high street, a park, a stadium concourse or a festival site. We typically see three technologies in the mix: outdoor-rated LiDAR for the main work (single sensor covering 20–40m), 60GHz radar where the install needs to be hidden behind architectural finishes, and thermal where total-darkness reliability matters. Wi-Fi probe counting still has a role at the very large end of the scale, where ±15% accuracy is acceptable in exchange for cheaper deployment density.
The buyers are business improvement districts, event organisers, stadium operators, and a growing number of local authorities running smart-city pilots. The data ends up in high-street performance reports, marketing-event attribution dashboards, crowd-safety briefings, and (increasingly) sponsorship-pricing models for outdoor advertising. The heatmaps article covers the analytics layer in more detail.
Side-by-Side: Which Technology Suits Which Industry?
| Industry | Best Technology | Typical Accuracy | Key Driver |
|---|---|---|---|
| Retail single-store | AI camera or 3D stereo | 96–99% | Conversion rate |
| Retail enterprise | 3D stereo | 98–99.5% | Like-for-like benchmarking |
| Shopping mall | 3D stereo + LiDAR zones | 98–99% | Tenant reporting |
| Airport / station | LiDAR | 99%+ | Queue & capacity |
| Bus / rail vehicle | 3D stereo or thermal APC | 97–99% | Schedule planning |
| Smart office | Thermal + 3D + desk sensors | 95–99% | Energy & space efficiency |
| Library / government | Thermal | 95–97% | Privacy & funding |
| Museum | Thermal + 3D zones | 95–98% | Exhibit analytics |
| Outdoor plaza / BID | LiDAR or radar | 95–99% | Weather-proof operation |
| Stadium / event | LiDAR + thermal | 97–99% | Crowd safety |
Vendor Specialisation by Industry
One thing we’ve learned in five years of vendor reviews: nobody is great everywhere. The retail specialists have spent years tuning for shop doorways and shopping-mall entrances; the airport specialists have spent the same time tuning for 20-metre concourses and harsh lighting; the smart-office specialists are obsessed with desk-level granularity. They all sell into adjacent segments and they’ll all tell you they’re strong there, but in practice the lines are pretty clear. RetailNext, ShopperTrak, V-Count and FootfallCam are dominant in retail. Xovis and Iris-GmbH are the airport heavyweights. Hella Aglaia and Eurotech control huge slices of bus and rail. Density and VergeSense lead smart-office. ShopperTrak, MallComm and EasyCounter show up most often in shopping malls. The full mapping lives in our Top Providers & Retail Clients, Top 30, and the All-50 Sensors Review.
ROI by Industry
- Retail — 2–6 month payback via conversion-rate and staffing optimisation
- Shopping malls — 6–12 months via tenant reporting fees and advertising uplift
- Airports — 9–18 months via queue-management efficiency and concession data
- Public transport — 12–24 months via schedule and fleet-size optimisation
- Smart offices — 12–18 months via HVAC/lighting energy savings (15–30% typical)
- Libraries / museums — payback measured in funding retained rather than revenue
- Outdoor / BID — 12–24 months via sponsor and tenant reporting income
Build your own model with our ROI Calculator & Business Case Guide.
Three Quick Project Stories
We’ve found these tend to land better than abstract numbers, so here are three quick ones from projects we’ve been close to.
A premium homewares brand, 28 UK stores. They’d been running off legacy break-beam counters for six years and treating the data as roughly correct. After we audited two flagship locations against manual counts, the gap was 22% on Saturdays — group entries collapsing to single counts. They moved to 3D stereo, and within three months the store-manager bonus structure (tied to conversion rate, naturally) had to be rebuilt because the new conversion numbers were lower across the board. Painful conversation, right answer.
A mid-sized European airport. They wanted live wait times at security and were quoted three months and a six-figure number by an incumbent. We helped them spec a smaller LiDAR pilot — eight sensors covering the busiest pinch points — that was live in five weeks. Six months in, peak wait times had dropped by about 40% because operations could move staff between lanes the moment a queue started building rather than 15 minutes after.
A national museum. They had a feeling certain galleries were under-visited but couldn’t prove it. We deployed thermal counters at every gallery threshold and discovered that one wing was getting 8% of total visits despite holding 30% of the collection — partly because the signage was confusing and partly because a single uninspiring transition corridor was acting as a filter. Two months of small fixes later, that wing was up to 17%.
What to Ask Before You Buy (By Industry)
If you’re shortlisting vendors, the questions that actually matter shift by industry. We end up asking slightly different things for a retail client than for an airport client. Here’s the short list we use.
Retail & mall buyers
- What’s your validated accuracy on group entries — not single shoppers — at a 1.4m wide doorway?
- How does your platform handle the connection to POS for live conversion, and which POS systems are pre-integrated?
- If we have 80 stores already counting on a different system, what does the migration look like?
- What’s the cost per store per year, all-in, with hardware amortised over 5 years?
Airport & transit buyers
- What’s your queue-length latency from sensor event to dashboard? (We want sub-30-second.)
- How do you handle GDPR and the local equivalent for biometric data — even though you don’t capture any?
- What’s your IP rating outdoors, and what’s your replacement turnaround if a sensor fails on a Friday at 18:00?
- How does the platform integrate with the airport ops centre and the airline-facing dashboards?
Smart-office buyers
- Does the sensor support both presence (PIR / radar) and counting (3D / AI) on the same SKU, or do we need to mix?
- How does it talk to our BMS, our desk-booking platform, and our badge system?
- What’s the install impact — is it Power over Ethernet only, or can we use battery-powered units in heritage buildings?
- What does the data look like aggregated for the works council? Can we show them the actual feed?
Public-sector buyers
- Is the sensor genuinely image-free — can we put that in the procurement documents without caveats?
- What evidence can we attach to a funding application about accuracy and audit trail?
- What’s the total cost of ownership over 7 years, given we want it to outlast the procurement cycle?
- How easy is it to add zone-level counting inside the building later, without ripping out the entrance install?
A Few Hidden Gotchas We’ve Seen Too Many Times
Most people counting projects we encounter as second opinions have at least one of these problems baked in. None of them are fatal but all are easier to fix at design time than after the install.
Sensors mounted at an angle “to save on cabling”. An angled sensor produces visibly worse counts than an overhead one. We’ve seen 5–10 percentage points of accuracy lost to this single decision. If the architect or installer is pushing for an angled mount, push back.
Counting employees with the customers. Almost every retail counter we’ve audited is counting staff entries during opening and closing as customer footfall. Two simple fixes — a configurable “staff entrance” zone, or schedule-based suppression for the first/last 30 minutes — clean this up. Most vendors support it. Most installs don’t use it.
The dashboard nobody opens. If the data lives in a separate platform from POS, BI and rota, store managers will stop opening it within a fortnight. The push-to-POS integration is the single most important spec line on the contract.
“Cloud-only” platforms with no export. A surprising number of vendors still lock raw counts to their own cloud. Insist on a documented REST export or scheduled CSV. You’ll thank us at the next platform RFP.
How We Think About Sector Choice
When a new buyer comes to us, the conversation almost always opens with “we want a people counter, what’s the best one?” That’s the wrong first question. The better first question is: which decision will this data drive, and how often? If the answer is “weekly executive review of conversion,” AI cameras feeding the POS work fine. If it’s “real-time queue management during a passenger surge,” only LiDAR will get there. If it’s “annual funding submission and capacity compliance,” thermal is genuinely the right answer even though it sounds boring.
The reason that framing matters: it stops you over-buying. We’ve seen retailers spend airport money on a 2-square-metre doorway. We’ve seen airports try to make 2D AI cameras work at a 25-metre concourse. Both groups would have been happier if someone had asked them, before they wrote the spec, what they actually needed the numbers to do.
Editor’s note. This hub is updated whenever a sector-defining shift happens in the market. Last meaningful update: March 2026, when Density acquired a competitor and reshaped the smart-office market overnight. If you spot something missing or stale, tell us.
Industry FAQ
Do I need different sensors for different industries?
Often yes. Indoor retail can use AI cameras, but outdoor stadiums need LiDAR or radar. Libraries usually require thermal for privacy. Match the sensor to the environment, not just the vendor preference. Our buying guide walks through the decision.
Which industry adopted people counting first?
Retail, in the early 1970s with break-beam counters at department-store entrances. Shopping malls followed in the late 1980s and airports in the 1990s with the rise of CCTV-based analytics.
What’s the fastest-growing industry segment in 2026?
Smart offices, driven by hybrid-working occupancy analytics, and outdoor smart-city deployments driven by BID and council investment. Both are growing at 25–35% year on year.
Where can I find more industry-specific guidance?
Browse our full library: Comprehensive Guide, Ultimate FAQ, and the 30 Burning Questions FAQ.
Next Steps
Now that you’ve identified your industry, dive deeper into the underlying technology in our People Counting Systems pillar guide, evaluate vendors with the 2026 Power List, and build the business case with our ROI Calculator.