Queue Management & Wait-Time Analytics: How People Counting Cuts Lines in 2026
Long lines cost money. Shoppers abandon baskets, travelers miss connections and visitors leave bad reviews. Yet many organizations still manage queues by gut feeling, opening another checkout only when the line is already out of control. Queue management with people counting replaces that guesswork with live data: how many people are waiting, how fast the line is moving, and how long the next person will wait.
This guide explains how queue analytics works, the metrics that matter, the sensors involved, and how retailers, airports, banks and venues use it to cut wait times.
What Is Queue Analytics?
Queue analytics measures three things in real time:
- Queue length – how many people are currently waiting in a defined zone.
- Throughput – how many people are served (leave the queue) per minute.
- Wait time – how long people spend in the queue, either measured directly or estimated from length and throughput.
Combined with entrance counts, it also predicts future demand: a surge of people entering the store now becomes a checkout peak 15–25 minutes later.
The Math Behind Wait-Time Prediction
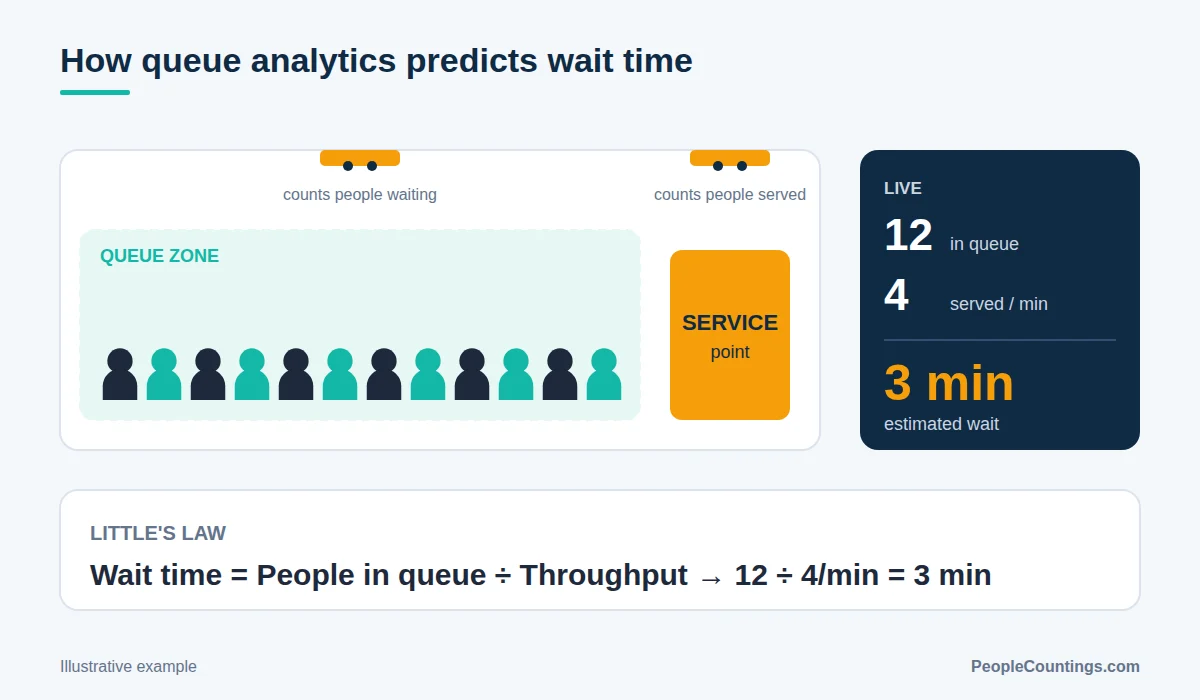
Most systems rely on a simple, well-established relationship from queueing theory called Little’s Law:
Average wait time = Number of people in queue ÷ Throughput rate
If 12 people are waiting and the counters serve 4 people per minute, the expected wait is about 3 minutes. Because sensors measure both numbers continuously, the estimate updates every few seconds and can be shown on screens (“Estimated wait: 3 min”) or pushed to staff.
Sensors Used for Queue Management
| Technology | How it is used | Notes |
|---|---|---|
| Overhead 3D / ToF sensors | Count people in queue zones and at service points | Accurate, anonymous; several units for long serpentines |
| LiDAR | Tracks movement through large queue areas | Ideal for airports and stadium gates; no images |
| AI video analytics | Uses existing or new cameras to detect people in zones | Flexible; must be configured for privacy (no storage, blurring) |
| Entrance counters | Forecast queue demand | Footfall today predicts checkout load minutes later |
| POS / transaction data | Validates throughput | Combine with sensor data for staff planning |
See our 2026 sensor comparison for details on each technology.
Key Queue Management KPIs
- Average and maximum wait time – the customer-facing number.
- Service level – share of customers served within a target time (e.g. 80% within 3 minutes).
- Queue abandonment – people who join and leave without being served.
- Open lanes vs. demand – whether the number of open tills or desks matches traffic.
- Throughput per lane – productivity of each service point.
For more store metrics, see 20 essential retail KPIs you can measure with people counting.
Use Cases by Industry
Retail and grocery
Live alerts tell managers to open another till before the line gets long. Footfall forecasts set checkout staffing by the hour, and self-checkout areas are monitored for congestion.
Airports
Security checkpoints, check-in and passport control publish wait times on screens and apps, and operators shift staff between checkpoints as flights bunch up.
Banks, government offices and healthcare
Service desks combine ticketing systems with counts to balance staff across counters and reduce waiting-room crowding.
Stadiums, theme parks and events
Gate, concession and ride queues are monitored so operations teams can redirect visitors or open extra points of sale during peaks.
How to Implement Queue Analytics
- Map the queue zones – define where the queue starts, where it ends and where service happens.
- Choose sensor coverage – ensure the entire queue zone, including overflow areas, is covered.
- Set targets – agree on a maximum acceptable wait and the alert thresholds.
- Connect alerts to people – send notifications to supervisors’ devices or radios, not just a dashboard.
- Display wait times – customers tolerate waits better when they know how long they will be.
- Review weekly – compare service levels with staffing plans and adjust rotas.
Frequently Asked Questions
How accurate are predicted wait times?
When queue length and throughput are measured reliably, Little’s Law estimates are typically close to actual waits for steady queues. Accuracy drops during sudden surges, which is why systems update estimates continuously.
Do I need cameras for queue management?
No. 3D, ToF and LiDAR sensors provide anonymous counts without recording identifiable images, which simplifies privacy compliance.
Can queue data integrate with workforce management?
Yes. Most platforms offer APIs so that footfall and queue forecasts feed scheduling tools and set staffing levels by hour.
What is a good target wait time?
It depends on the sector and customer expectations. Many retailers aim for a few minutes at checkout; airports and public services set their own published standards.
Shorter Lines Start With Better Data
Queue analytics turns lines into a managed process: you see congestion forming, act before customers leave, and plan staffing from real demand. Explore providers with strong queue features in our 2026 Power List, or request a free quote to compare solutions for your site.